Designing an effective diagram may seem straightforward, but many diagrams fall short because their design leaves the viewer feeling confused and disengaged. This post discusses common reasons for bad flowchart design—including ambiguity, lack of relevance to the target audience, useless feedback loops, information overload, and poor choices in flowchart symbols.
In this post, we’ll explain why these issues exist and provide solutions for avoiding them in your own diagrams.
Your Diagram is Ambiguous.
Ambiguity is one of the biggest issues that can ruin an otherwise good diagram. Here are some common sources of ambiguity in flowcharts and ways to fix them.
a. Too many branches leave a process step.
Your audience shouldn’t have to work hard at understanding your diagram. They should be able to glance at it and immediately understand what the flowchart is saying – ideally without a legend or a tutorial. If you have more than three branches leaving a step, your audience might feel overwhelmed and confused by all of the different options they’re being asked to choose from.
If this happens, simplify your diagram by consolidating or removing some of the unnecessary branches. This will help remove any ambiguity about what your audience is supposed to do next.
b. Parallel steps with unclear relationships.
A common source of ambiguity in flowcharts is a group of parallel process steps that have no clear relationship between them. When creating your diagram, make sure you show the sequence of your processes and highlight any hierarchies between process steps.
A common problem here is when you have a group of repeatable steps that are all shown in the same circular flow. This makes it difficult to know which steps are related or whether there’s any hierarchy between them. The solution is to show related process steps in the same horizontal row and create a hierarchy by making each step’s border a different color.
c. Overlapping symbols create confusion.
Flowcharts use lots of symbols to represent common business activities, such as putting an item into inventory or adding an item to a shopping cart. If you use similar symbols for different activities, it might create confusion.
A good example is the “add to cart” symbol, which looks very similar to a shopping cart. In order to avoid any ambiguity, some companies choose to standardize on a single flowchart symbol for adding an item to inventory and creating an invoice for that item—so they don’t have to remember which symbol means what.
Your Diagram Doesn’t Show All of the Necessary Steps.
When designing your flowchart, remember that each step is just one possible path through your diagram. Make sure you include every step that your audience might take in their journey through the diagram. If you leave out important steps, your audience could get stuck and lose trust in your diagram’s accuracy.
A common mistake is to assume that someone following a flowchart will know how to perform all the necessary steps before they start following it. You can avoid this issue by adding helpful “What comes before” and “What comes next” labels to the beginning and end of each step.
Your Diagram is Too Complex for its Target Audience.
Remember who your audience will be and how familiar they are with the processes you’re showing them. If you create a diagram that’s too complex, people won’t understand what it’s supposed to be showing them or how to follow each step.
If possible, talk with your audience about what they like and don’t like. Their feedback can make it easier for you to create a better flowchart that helps them understand their processes even more clearly.
You Don’t Have Enough Context.
A good diagram is only as good as the context surrounding it—so if you’re showing your audience too much, you might not be helping them.
For example, if someone is following a flowchart for completing a purchase, the diagram only provides useful instructions after they have inputted their payment information. A flowchart of all possible purchase steps is overwhelming and puts too much focus on filling in the blanks—which makes your audience feel like they’re doing data entry rather than completing a purchase.
You Have the Wrong Diagram Style for your Audience.
Today, there are many different flowchart styles and templates available to help you create the diagram that best suits your audience and their processes.
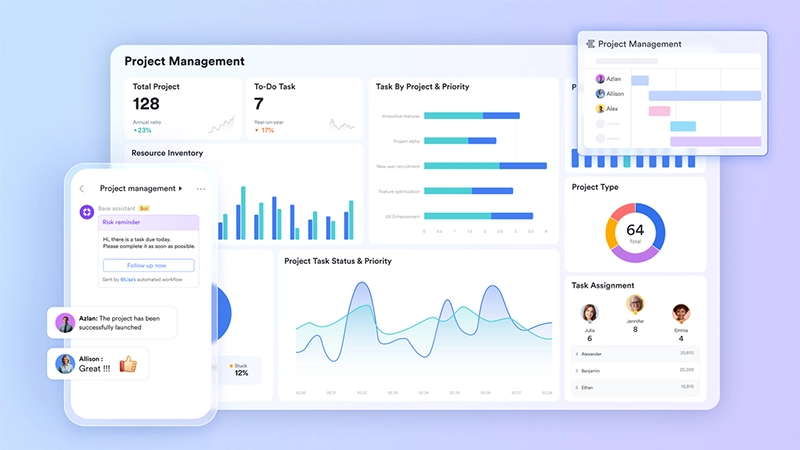
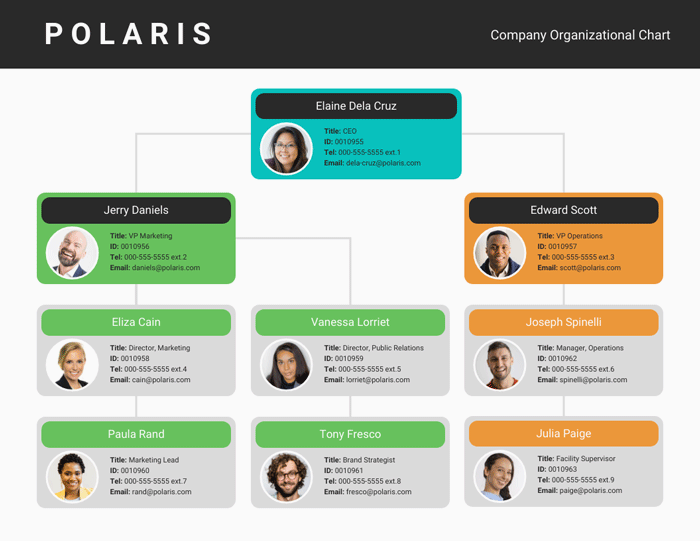
For example, if you want your audience to focus on their processes and feel like they’re building something together with you, then a dynamic diagram would be most effective. If you want your audience to easily identify the steps in their individual process, then an organizational chart might be best.
You Don’t Have Clear Instructions.
Always include clear instructions with each step in your flowchart. While every diagram is different, here are some general guidelines about what to include in each step:
- Why: Explain why someone should perform this step.
- How: Show how to perform this step.
- When: Explain when someone should consider performing this step. If it’s not necessary, make sure you include that information too.
- Who: Show who performs each step in your diagram because there might be multiple actors involved in the process at different stages.
- Where: Label each step with a specific location if possible.
Example: Label your steps with the object each step is related to, such as “order” for an order or “billing information” for billing information.One great tip when making diagrams is to use Venngage—an online diagram /poster maker and one of the best infographic makers that provides a wide range of diagram templates for everyone. Here are some diagram examples from their website!
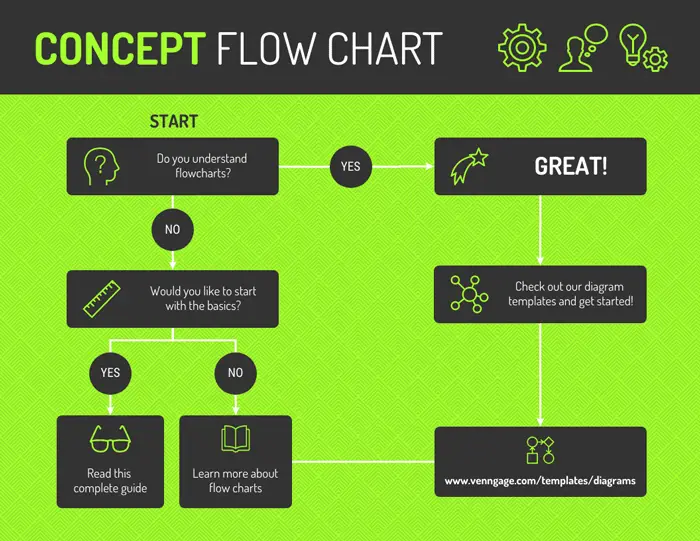
Flowcharts can be a useful tool for explaining processes that aren’t easy to explain in written form. Using the right symbols and adding helpful labels can help you create an effective diagram that your audience is sure to understand and trust.
If you’re looking for free software dedicated to creating flowcharts and other diagram templates, then consider using Venngage—it’s simple to use and can help you create professional-looking diagrams in just minutes. What are you waiting for? Check out their website today and start making your own diagram!